In the nation's capital, Delhi, voting for the assembly elections has concluded, and now we await February 8th for the results. Ahead of the announcement, separate surveys by C-Voter and Today's Chanakya have been revealed. According to Today's Chanakya, the Aam Aadmi Party is estimated to secure 19 seats, while the BJP might win 51 seats, potentially ending a 27-year dry spell for the BJP. However, Today's Chanakya noted a margin of six seats, indicating the results could slightly differ. As per this survey, Congress does not seem poised to make any breakthroughs.
Meanwhile, C-Voter's survey indicates a strong inclination of women voters towards the Aam Aadmi Party (AAP), with an estimated 50.7% voter share. The BJP is estimated to receive a 34.3% share, and Congress about 6.8%. Among male voters, the trend appears to lean more towards the BJP, with an estimated 51.4% voter share, compared to 34.4% for AAP, and just 6.5% for Congress. Notably, C-Voter did not provide seat predictions.
Who Voted for Whom?
According to C-Voter, 40.7% of voters aged 18-22 have voted for the BJP. In the same age bracket, 46.7% voted for AAP, and 6.9% for Congress. Additionally, in the 23-35 age range, AAP leads with 45.4% votes, BJP close behind with 40.1%, and Congress with 7.4%. Among 36-45-year-olds, 44.6% voted for BJP, 40.8% for AAP, and 6.1% for Congress. Voters aged 46-55 showed 48.1% support for BJP, 37.3% for AAP, and 6.8% for Congress. For those over 55, 49.9% leaned towards BJP, 35% towards AAP, and 5.4% towards Congress.
Vote Distribution by Caste
In the Delhi elections, the general caste's primary preference was BJP, with 59.3% of votes. AAP received 29.3%, and Congress garnered 3.5%.
Trust Among Muslim Voters According to C-Voter
AAP- 63.1%BJP- 12.7%Congress- 18.7%
OBC Voters' Preference
AAP- 38%BJP-49.3%Congress- 5.1%
SC Voters' Leanings
AAP- 46.9%BJP-37.9%Congress- 6.9%
Who the Sikh Community Prefers
AAP- 49.1%BJP- 34.4%Congress- 2.6%
Source: aajtak
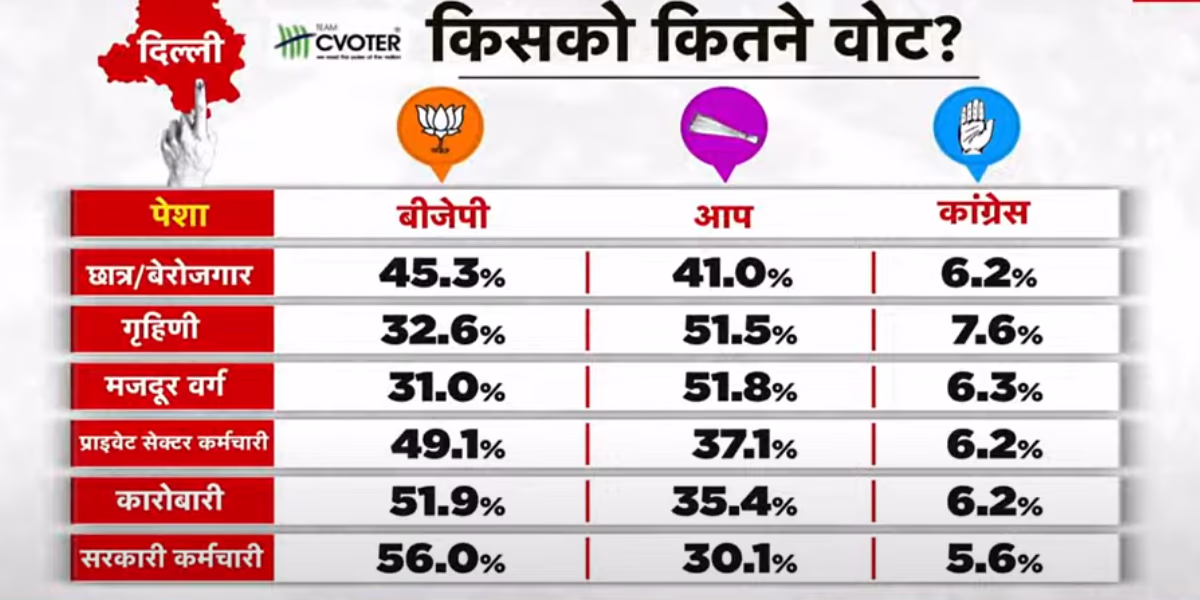
Professional Group Voting Patterns
Students / Unemployed
BJP- 45.3%AAP-41%Congress-6.2%
Homemakers
BJP- 32.6%AAP-51.5%Congress-7.6%
Laborers
BJP- 31%AAP-51.8%Congress-6.3%
Private Sector Employees
BJP- 49.1%AAP-37.1%Congress-6.2%
Businesspersons
BJP- 51.9%AAP-35.4%Congress-6.2%
Government Employees
BJP-56%AAP-30.1%Congress-5.6%